Chartanalysen Square - Charttypes
Candlestickchart
The Candlestickchart is present next to the bar chart is the most popular and therefore a common option a course development.
Used, this type of "evolution representation" in the 17th Century Japan, where they were used by traders.
The way into the "modern" chart analysis but found only in the 90s. Similar to the bar here is a candle for the analysis period (1 day = 1 candle). By the wider "body" of the candle charts, information can be optically detect a little faster.
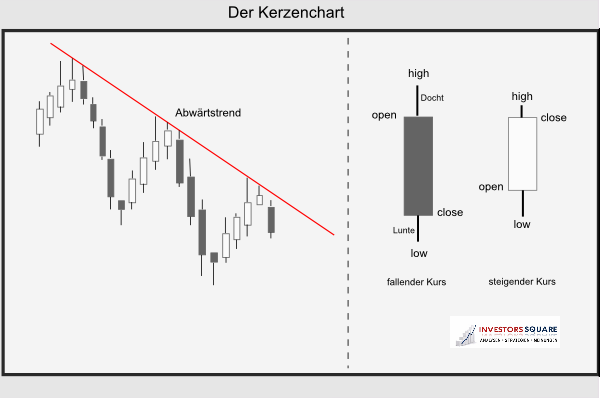
The structure shows the intraday price movements, where the daily high is represented as a wick (top) and the depth is marked by a fuse.
The body indicates the difference between the opening and closing price. This body is according to the daily performance of either white (bullish) or when prices fall filled with black (bearish). This coloring is of course also be changed manually.
For a trained chartist already holds a single candle provides an interesting grouping of information. Combinations of several candles also generate patterns that are used in many technical analysts as indicators (Candlestick analysis).
The following figure shows a Candlestickchart:

