Chartanalysen Square - Charttypes
Linechart
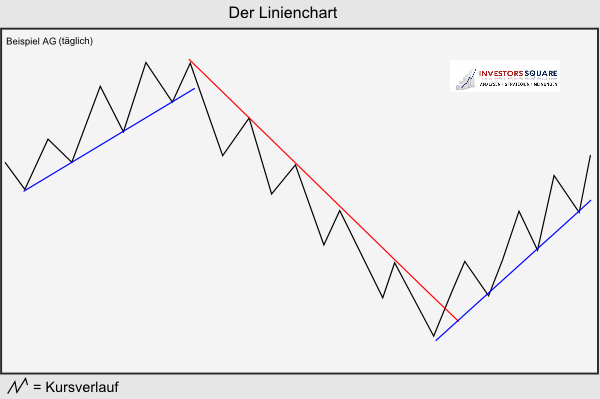
The line chart is the simplest way to represent a development of courses. He considers only the closing price of the chosen representation period (eg one day).
This closing price points per day are then connected and thus represented as a line.
This simple chart type has accordingly the disadvantage that no intraday fluctuations can be mapped. These important "OHLC" data (Open, High, Low, Close), but it is essential for an active trader.
The following illustration shows a simple line chart:

