Chartanalysen Square
Indicators
Welcome to the chapter for indicators in technical analysis!
In almost every chart of different financial markets (indices, stocks, commodities, currencies, etc.) we find indicators that assist the analyst in interpreting the price curve and give
him signals of likely scenarios / further developments.
The technical indicators are calculated using mathematical formulas and transmitted graphically in the chart.
A fundamental distinction between:
Oscillators
Moving Averages
Volume Indicators
Oscillators
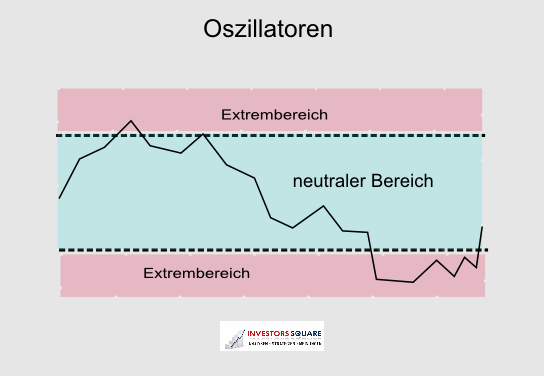
Oscillators oscillate between extreme value principle areas. They are used to determine lucrative Einstiegs-/Ausstiegszeitpunkte and to find differences and inserted below the main chart.
The following figure shows the characteristic representation of oscillators:
Moving Averages
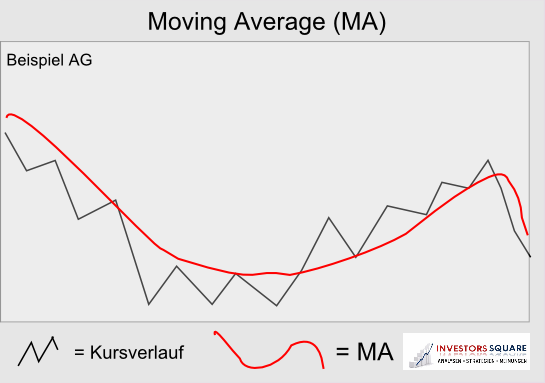
Moving averages (MA) are also very common. They reflect the pricing of average prices over a definable period of time and are displayed directly in the chart.
By smoothing the average analyst recognizes the technical direction of the trend, support and resistance and trade signals.

Volume Indicators
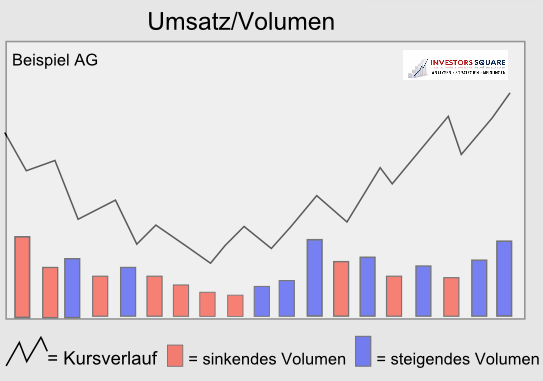
Through the presentation of sales (also called volume) gives the analyst information on the sustainability of a trend or the confirmation of trend reversal. Besides the price and time factors, the number incurred in transactions to a defined time (volume), a reliable indicator.
In addition to the shape shown in the illustration of the volume, there are also revenue-based oscillators and other technical indicators:

