Chartanalysen Square - Formations
Continuation Patterns
On this page you will find a selection of important chart patterns , which make it easier for traders to identify profitable trades!
The presented figures show the rule-compliant resolution of continuation patterns .
Compliant rule in this context means that a very high likelihood that
these setups occur in the following form. Yet there is a (small) risk remains that the
Formation is not resolved conform with the rules. Here too, therefore a Stop-Loss
Info:
Stop-loss order is an order (usually for shares or derivatives) that is executed, and the
current share price reaches a predetermined value. The aim of this type of order is to limit losses and gains useful safeguard. is essential!
Warning: can also be shown as triangles and wedges Top-/Bottomformation initiate a turnaround!
Bullishe Continuation Patterns
- Bullish flag
- Bullish pennant
- Bullish rectangle
- Bullish Falling Wedge
- Ascending triangle
- Bullish symmetrical triangle
Bearishe Continuation Patterns
Bullish Flag
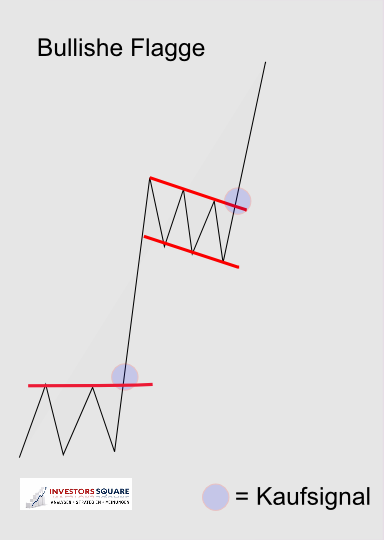
The Bullish Flag (Bullflag)
The bullish flag (Bullflag) is characterized in that one at fracture Resistance takes place a very steep rise (flagpole), followed by a brief consolidation (as a flag) follows against the actual uptrend.
This flag is a break up, starts the second steep rise, which roughly same extent as the first increase comprises.
As a rough guide and the target price forecast can be said that the "flag" to approximately "Half-mast" blows!
TopBullish Pennant
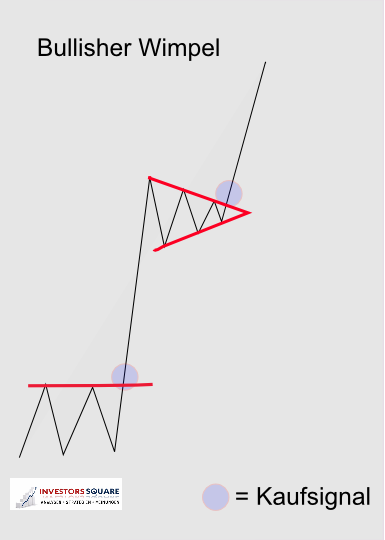
The Bullish Pennant
When bullish pennant, the situation is identical to Bullflag. the consolidation to "half-mast" however, takes place in the form of a pennant.
Here, too, can be very good trading buy signals including price targets.
TopBullish Rectangle
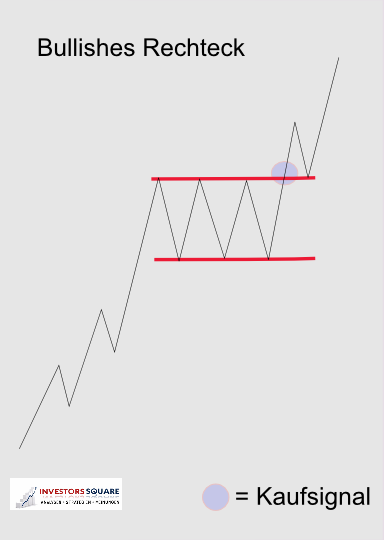
The Bullish Rectangle
The rectangle has a bullish uptrend intact until this in a particular area and it meets a resistance to a lateral consolidation within a "sliding zone" comes.
The course is now moving in the rectangle between support (bottom) and Resistance (above) back and forth.
With breakout above the resistance of the sliding zone is the original trend continued. With a Kiss Back to the support area has become, should be expected.
TopBullish Falling Wedge
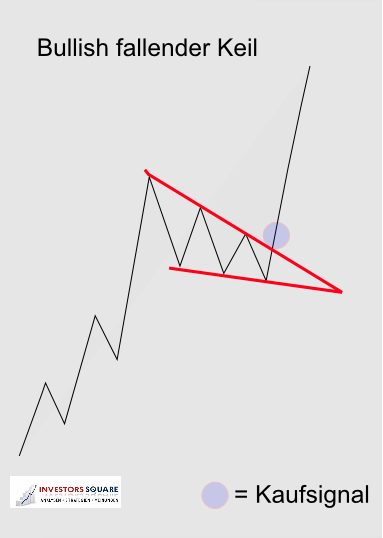
The Bullish Falling Wedge
Also in the bullish falling wedge the starting point is an intact uptrend of hits in a certain range on a resistor.
From here, the price development characterizes the training of falling highs and lower lows, However, in the arrangement of their "jam in".
By breaks of course the upper trend line of the wedge, the original trend resumes.
TopAscending Triangle
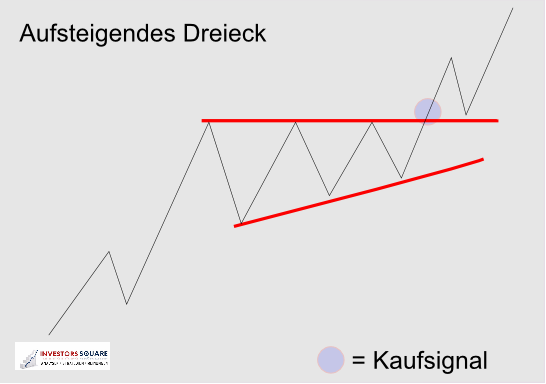
The Ascending Triangle
Even when ascending triangle, we find an intact uptrend in the a specific area on a stronger resistance encountered.
The following consolidation is characterized in that at increasing the highs lows continue in the area of resistance lie. The resulting setup thus shows an ascending triangle.
With exceed the resistance of the original trend is resumed. Again, this should be expected with a Kiss Back to the support area (former resistance).
TopBullish Symmetrical Triangle
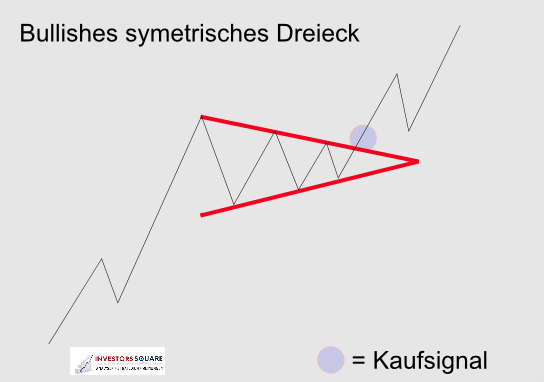
The Bullish Symmetrical Triangle
The starting position of bullish symmetrical triangle is identical to the ascending triangle.
On consolidation, but lower highs and higher lows are trained which forms itself into a symmetrical triangle.
This triangle is a break up, the original uptrend continued.
TopBearish Flag
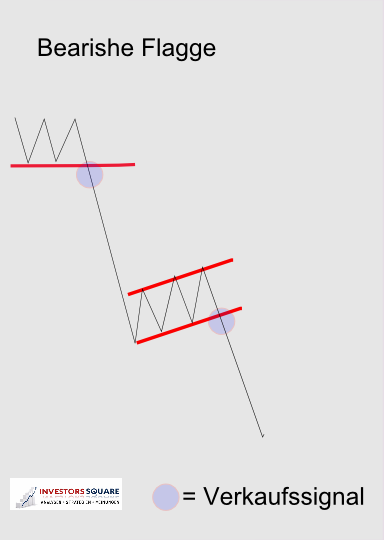
The Bearish Flag
The bearish flag (Bearflag) is characterized in that one at fracture Support a very strong price decline (flagpole) takes place, which (a short form of a consolidation Flag) follows against the actual downtrend.
This flag is broken down, beginning the second steep downturn that approximately the same extension which, like the first one.
As a rough guide and the target price forecast can be said that the "flag" about to "half-mast" blows!
TopBearish Pennant
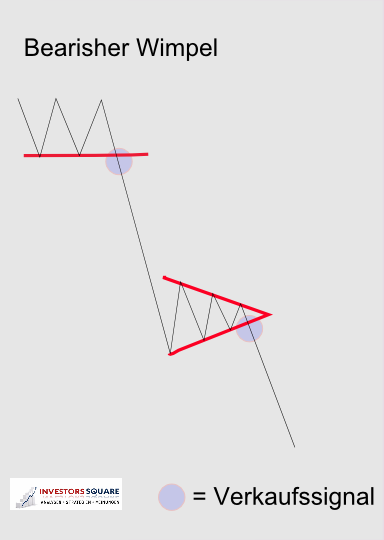
The Bearish Pennant
When bearish pennant, the situation is identical to Bearflag. The consolidation "Half-staff" does not take place in the form of a pennant.
Here, too, can be very good trading signals, including the sale price targets.
TopBearish Rectangle
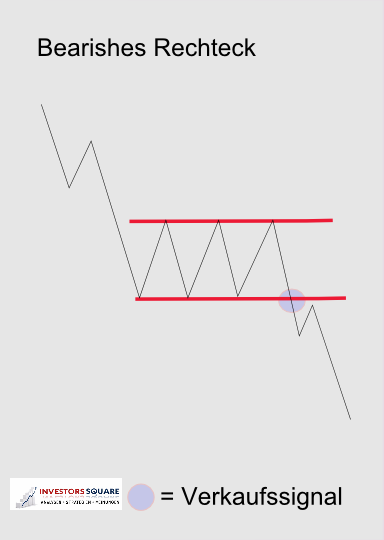
The Bearish Rectangle
The rectangle has a bearish downtrend intact until this in a certain Area to support and take it to a lateral consolidation within a "sliding zone" is.
The course is now moving in the rectangle between support (bottom) and resistance (above) back and forth.
With the support of the original fracture trend continues. with a Kiss back on the field for resistance become, should be expected.
TopBearish Rising Wedge
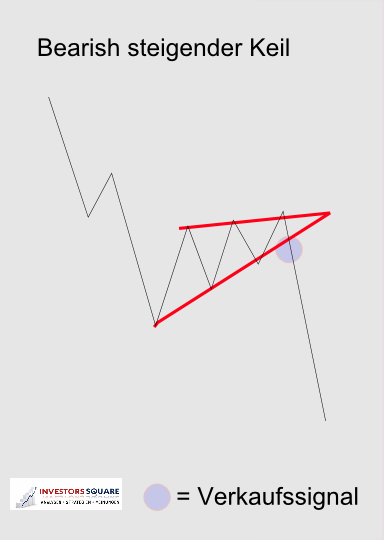
The Bearish Rising Wedge
Even when bearish rising wedge the starting position is a downtrend intact, of hits in a certain area on a support.
From here, the price development characterizes the education of rising lows and highs rising, However, in the arrangement of their "jam in".
By breaks of course the lower trend line of the wedge, the original trend resumed.
TopDescending Triangle
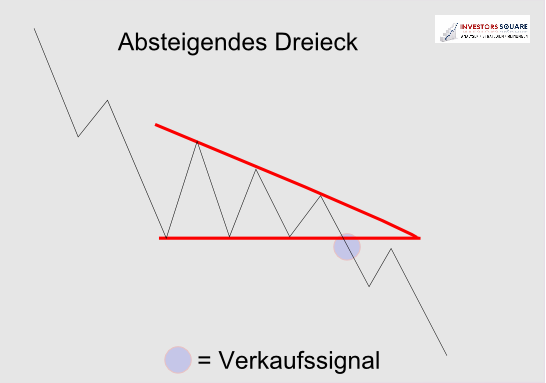
The Descending Triangle
Even when descending triangle, we find an intact downward trend in specific area on a stronger support comes.
The following consolidation is characterized by the fact that in times of falling highs the lows continue to provide support lie. The resulting setup thus shows a descending triangle.
Below with the support of the original trend is resumed. Here, too, with a Kiss back in the resistance area should (former support) are expected.
TopBearish Symmetrical Triangle
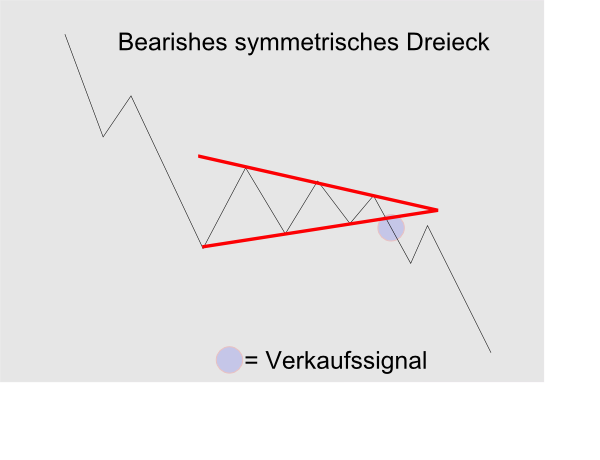
The Bearish Symmetrical Triangle
The starting position of bearish symmetrical triangle is identical to the descending Triangle.
On consolidation, however, higher lows and lower highs are formed, which are shaped to form a symmetrical triangle.
This triangle is broken down, the original downtrend continued.
Top