Chartanalyse Square - Indicators
Moving Average (MA)
The moving average is one of the most popular trend-following tools in technical analysis. smoothing historical rate of selectable segments and their output in the form visualized a line, an indication of the prevailing trends.
In his role as a signal generator and evaluator of a trend, can trend continuations and reversals better analyzed be. He gives good results in market phases which are distinguish clear trend phases, whereas he in sideways markets no satisfactory signals supplies.
In addition to the identification of trend movements, the "crossing" of two or more moving average used as Buy-/Sellsignal. This varies the technical analyst on the historical sections of the course, the MAs are calculated and then if the "faster" MA-line crosses the line of the sluggish MAs is either close out an existing position or a new position in the direction of the "future" trends open.
Crossing of the Moving Averages

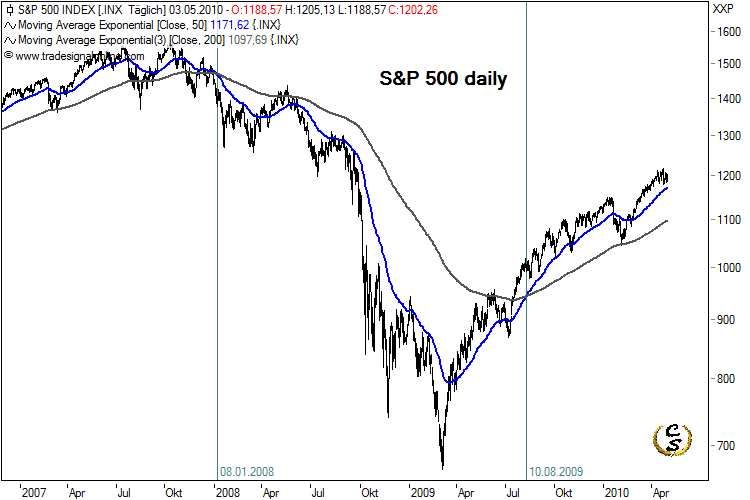
The figure shows a daily chart of the S&P500 with two moving averages. On 08/01/2008 crosses the faster 50s EMA (exponetieller moving average) signals the sluggish 200 EMA from top to bottom and in weakness of the market.
The losses led to a drop in the moving averages. As the prices now below the EMAs move these lines now act as resistance movements at rest against the bearish trend. only in April 2009, there was a turnaround in the 50 EMA and the resulting bullish cross on 10/08/2009. Since then, on this basis, there is an intact uptrend against the S&P500.
