Chartanalysen Square - Fibonacci
Time Projections
The term projections based on the Fibonacci number series is another interesting part of chart analysis. The aim is to limit future turning points in time. Arise in this area Fibonacci time targets interesting chart setups (turnaround), those will be confirmed according to time.
The Fibonacci time projections therefore increase the likelihood that it will be in these areas Trend reversals comes. With this knowledge, the number of hits of their own trades increased.
Time Projections
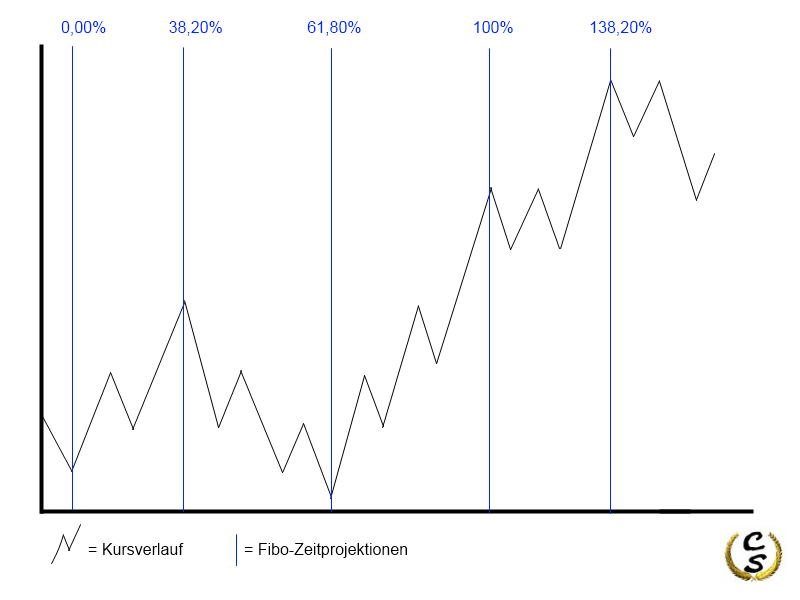
The following figure shows an example of vertical Fibonacci time targets. The price of the underlying over the range of time projections special dynamic.

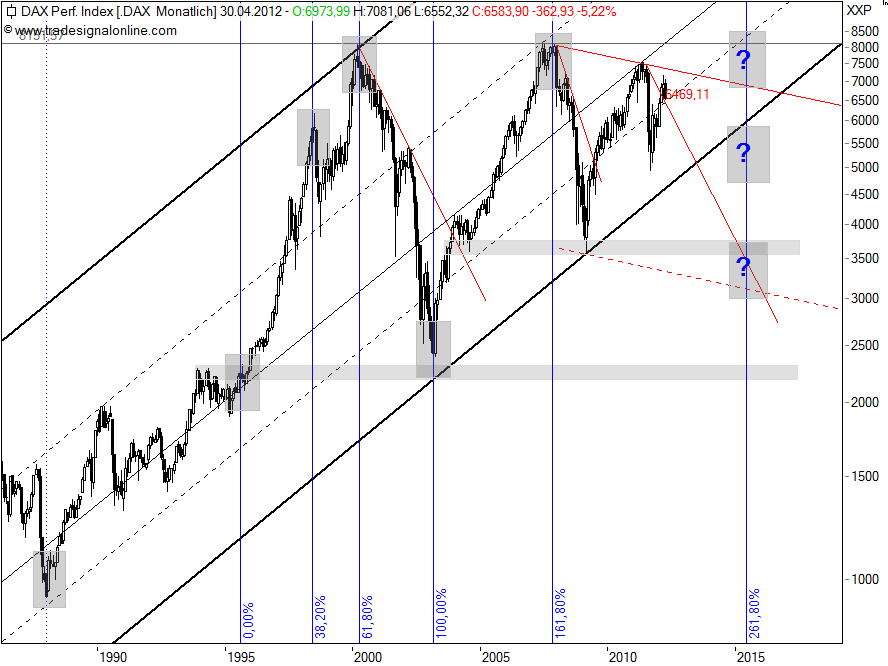
As a small example we see in the next figure the monthly chart of the Dow. Since the striking low in January 1988, we see a dynamic rally. The chart with the tool "Fibonacci projections" inserted vertical lines clearly show that it temporally associated with these objectives / lines to significant price movements and reversals- came.
The next line of projection is in June 2015. We will see if it is even in places with interesting movements.

Of course you should never consider this period goals in isolation, but on affirmative chart pattern look but try this interesting method a try.
