Chartanalyse Square - Indicators
Bollinger Bands
Named for its developer John Bollinger "Bollinger Bands" or "Bollinger Bands" are a wide analysis tool common in technical analysis of financial markets.
After being published in the 1980s, the Bollinger Bands refined again and again or by more settings added. In your standard version is a 20-day Moving Avarage (MA) generated and surrounded by the Bollinger Bands. The lower / upper band in each case is two standard deviations from MA away.
The standard deviation is used in statistics to illustrate the extent to which the investigated Values scatter around the calculated average. The distance between two standard deviations used so that at least 95% of the price data fall into the gap of the Bollinger Bands.
Trading Approaches
1. Narrowing Bollinger Bands

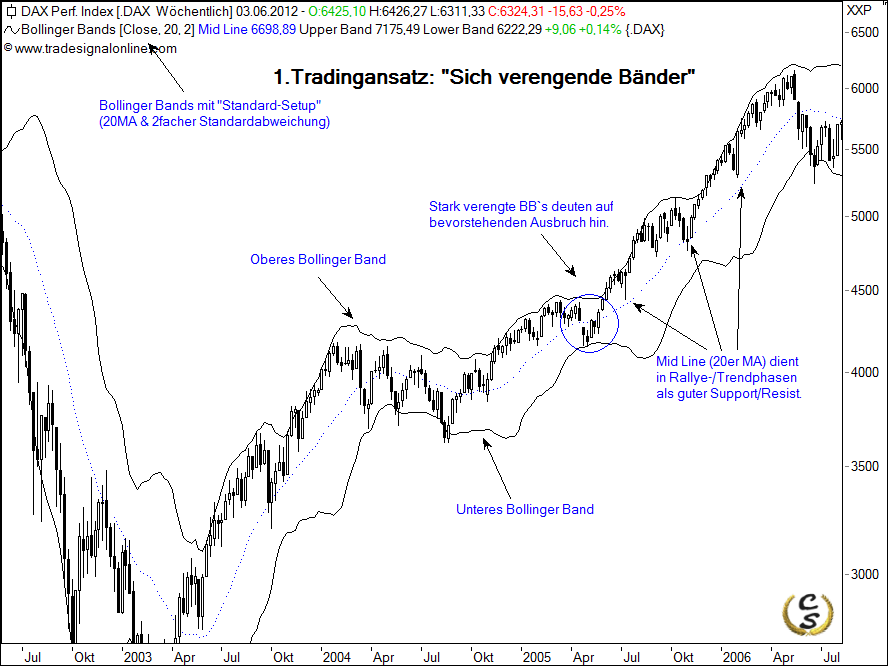
The figure shows a phase in early 2005, in the narrow Bollinger bands. This reflects a Volatility is decreasing again. Trading offers a chance when this tapered channel will leave in one direction! Often this is done dynamically and introduces an extended rally or the correction. In our example, the rates of break up and during the dynamic rally only Mid-Line correction achieved in phases.
2. Trading opportunity in the bands

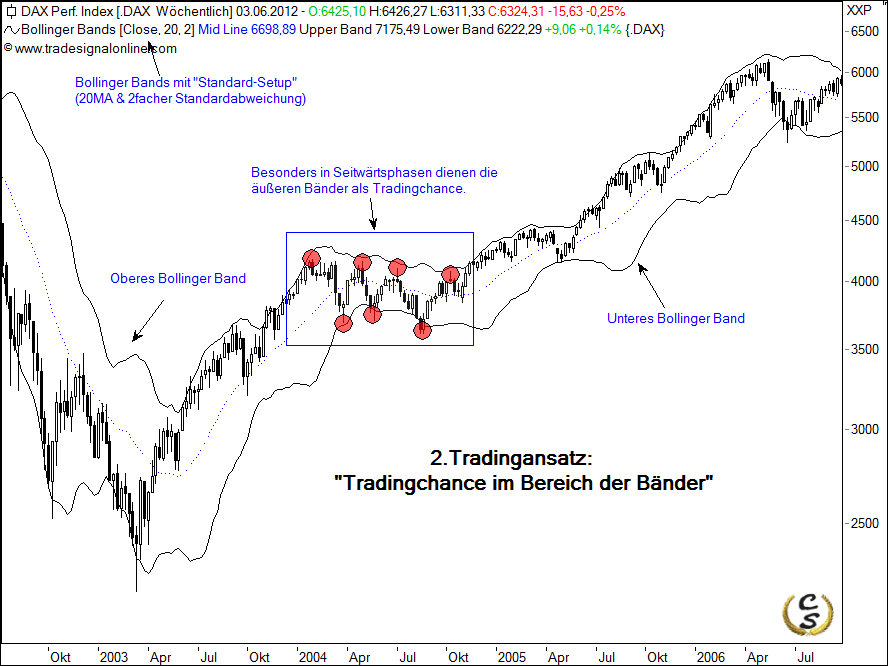
Especially in the sideways phase upper / lower band serves as a "Kursbegrenzer". The area of the bands therefore can be used for entry. Particular attention should also be on the candlestick body . place A shooting star, hammer, Hanging Man, etc. (ie all with long / r wick / fuse) underlines a counter-movement that opposed us in a sideways again according to Bollinger Band performs.
3. Exaggerations

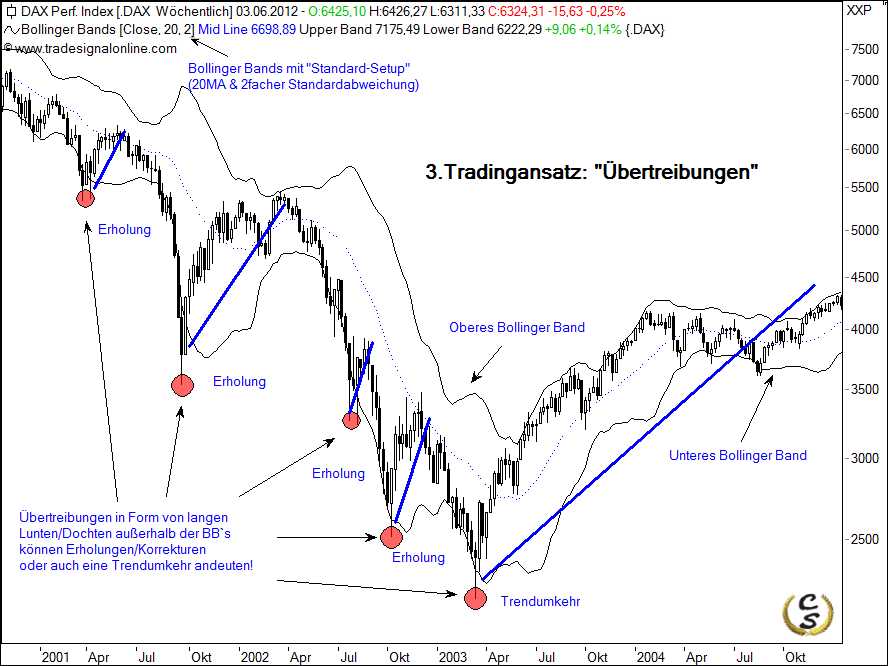
Exaggerations are also displayed in the Bollinger Bands. This "price spikes" are generally outside the bands and here also indicate the individual candlestick body a short to medium term backlash on. In March 2003, served as an indicator for the exaggeration subsequent reversal.
