Chartanalysen Square - Indicators
Momentum
The momentum of one of the most popular indicators in technical analysis. He visualized the momentum / the speed of a trend. If we define momentum and velocity as momentum, so the momentum of these same measures dynamics in an actual movement. For the chartists are observations such as the weakening of an existing trends of particular importance.
The approach is similar to the dynamic oscillations of a bungee jumper. After take-off and the subsequent free-fall phase provides a strong dynamic / high acceleration. Begins at a certain point the tension of the rope brake the case, while the jumper falls while further towards the floor, but the momentum is lost. This "warning" should incorporate the chartist in his assessment.
At some point there will be a reversal. The bungee jumper has almost its lowest point jump reached and from that date provides the tension of the bungee rope that the Springer in the opposite direction is accelerated. There is a trend reversal, the analysts said previously by the "warning" was announced.
As a result, a momentum analysis can we get the following:
- Momentum negative and decreasing = an existing downtrend is accelerating (1st phase jump)
- Momentum negative and growing = an existing downtrend slowed (2nd phase jump)
- Momentum positive and rising = an existing trend is accelerating (3rd phase jump)
- Momentum positive and decreasing = an existing uptrend bebremst (4th jump phase)
Outline of the Momentum - Oscillator

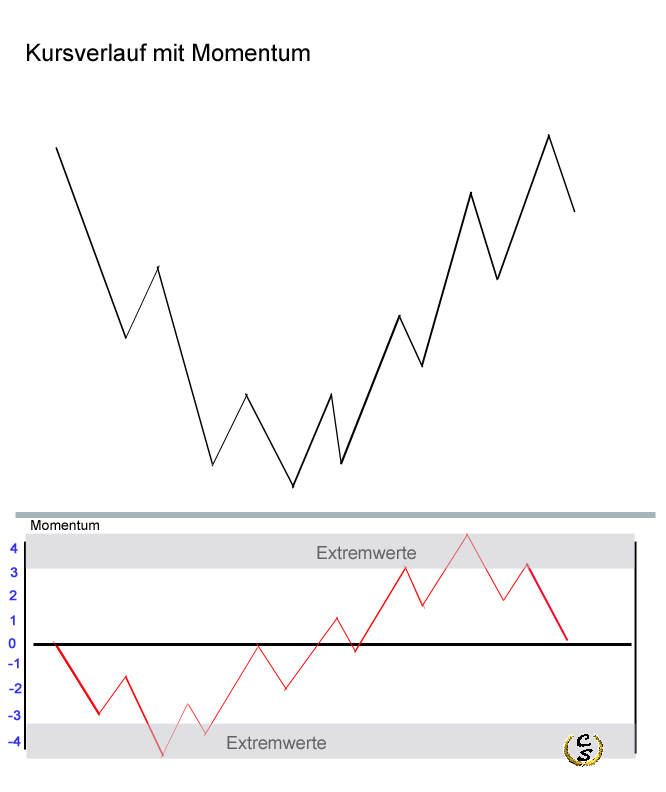
The figure shows the above stages of momentum. Analysts use the information on the indicator different ways. Some interpret until the crossing of the zero line from Buy-/Sellsignal, others use extreme values in order to make investment decisions, and others look very carefully for unusual Divergences.
Since I always make my chart analyzes without indicators, I can from my own experience to the little different starting points say.
However, if I set a time indicator in my chart, so I look personally mainly on whether Divergences confirm my observations of the formation analysis.
Extreme values of the momentum

The extreme values generally indicate an overbought or oversold a value. Open positions should be protected here at least close!
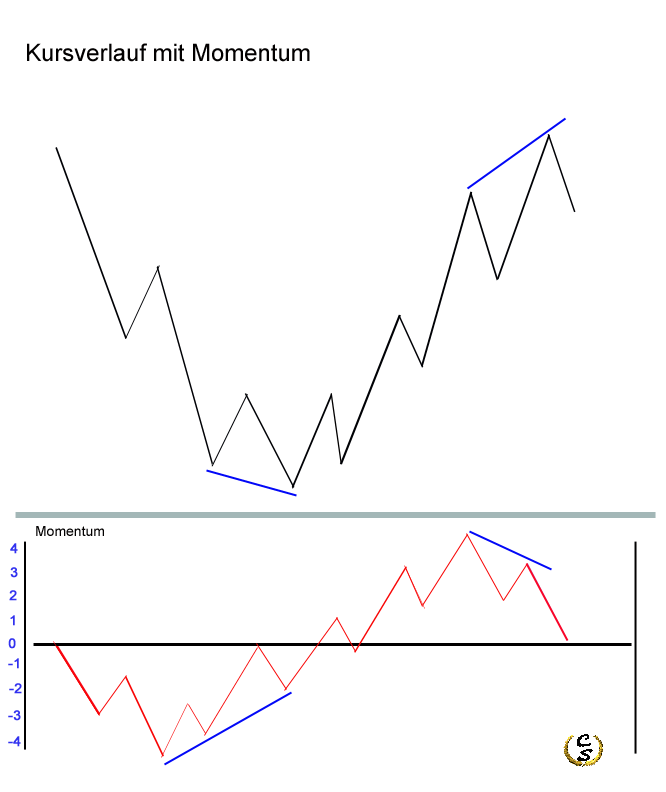
Divergences of the Momentum

Divergence between price and indicator-course visualize the chartist that the price development base value of a is no longer supported by the indicator. This "warning" was also in the risk management of existing Positions are taken into account, or may be supportive for the preparation of a trade in the opposite direction be helpful (eg, identification of reversal patterns)
