Chartanalysen Square - Formations
Candlestick Pattern
In technical analysis, the individual candles are considered happy isolated. From the patterns obtained by Opening price, intraday volatility and closing occur, can derive different meanings. The most important candlestick patterns are shown on this page.
Bullishe Candlestick Pattern:
- Hammer
- Inverted Hammer
- Bullish Engulfing
- Bullish Harami
- Piercing Line
- Bullish Doji Star
- Morning Star
- Morning Doji Star
- Bullisch Abandoned Baby
Bearishe Candlestick Pattern:
- Hanging Man
- Shooting Star
- Bearish Engulfing
- Bearish Harami
- Dark Cloud Cover
- Bearish Doji Star
- Evening Star
- Evening Doji Star
- Bearish Abandoned Baby
Hammer
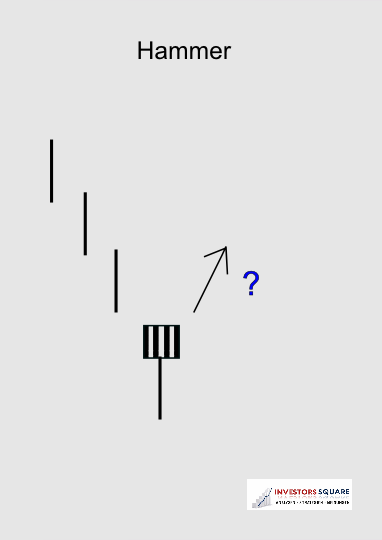
The Hammer
A very striking and frequent candlestick pattern is the "hammer". His little body with "shaved head" and a long lower shadow are its distinguishing characteristics.
The occurrence of a "hammer" is considered trendabschwächend and often signals a reversal area.
The fill color of the Bodies play even matter.
to the topHanging Man
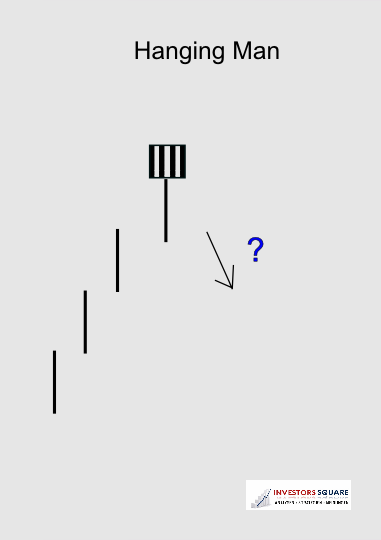
The Hanging Man
The pendant to "hammer" the "Hanging Man" is. This pattern is also trendabschwächend evaluated occurs but in uptrends on to reverse fields.
The fill color of the Bodies play even matter.
to the topShooting Star
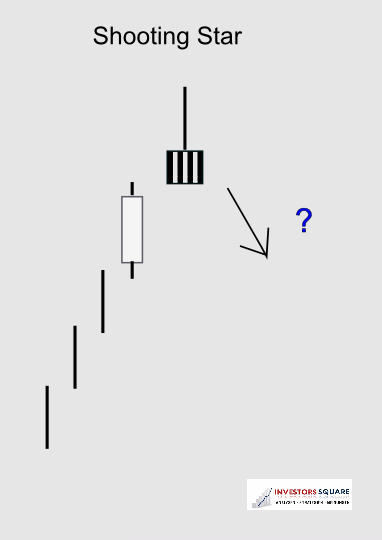
The Shooting Star
In an uptrend a candlestick pattern occurs with a small body and a long upper Shadows, this is rated as a weakening trend and alarm and "Star Schooling Ting" as designated.
Also during the "Schooling Ting Star" the fill color is secondary.
to the topInverted Hammer
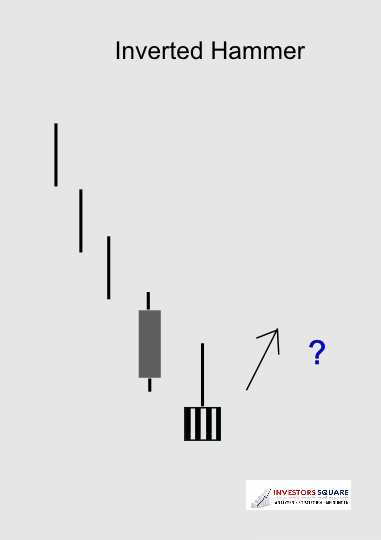
The Inverted Hammer
The "Inverted Hammer" is the Pendant to "Shooting Star" and is on a downward trend as Reverse indicator considered.
The Bears should take at this point a portion of your winnings. Here, too, is Fill the secondary.
to the topBullish Engulfing
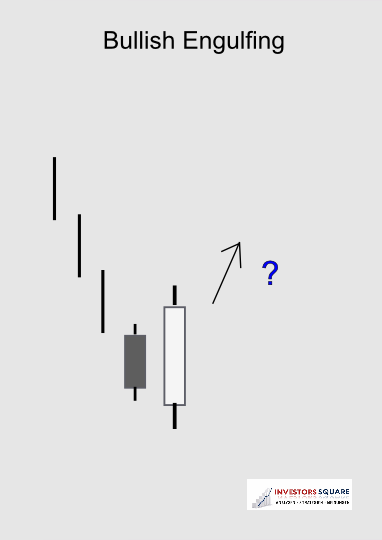
The Bullish Engulfing
Occurs in a downtrend on a large white candlestick whose body completely the previous black candle surrounds, this type of pattern as a "bullish engulfing".
to the topBearish Engulfing
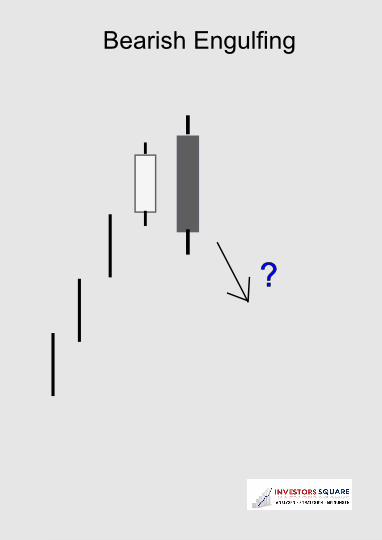
The Bearish Engulfing
The "Bearish Engulfing" occurs in contrast to his bullish pendant in a Uptrend and is to be negative.
to the topBullish Harami
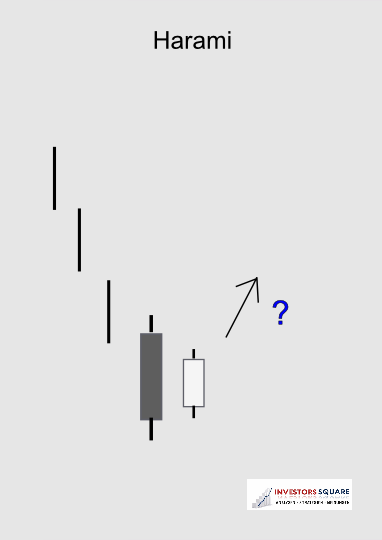
The Bullish Harami
The Bullish Harami occurs in a downtrend intact and signaled its weakening.
The traded price range lies within the last bearish candle. On the trading of the Harami should a significant Trade volume increases to support the impending reversal
to the topBearish Harami
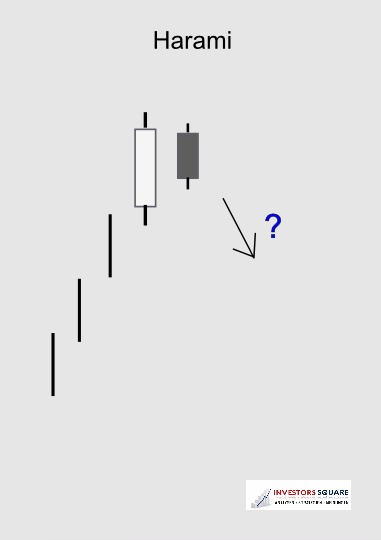
The Bearish Harami
The Bullish Harami occurs in an intact uptrend and signals its weakening.
The traded price range lies within the last bullish candle. On the trading of the Harami should a significant Trade volume increases to support the impending reversal
to the topPiercing Line
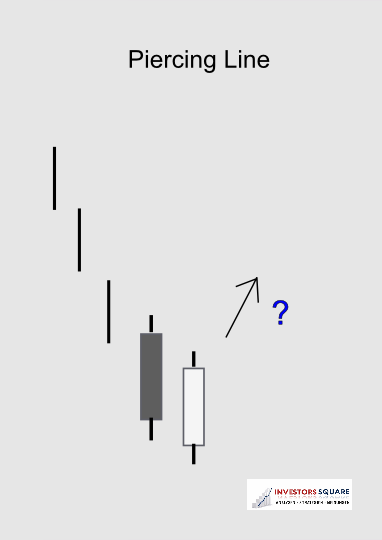
The Piercing Line (bullish and bearish)
The Piercing Line is a two-candle reversal pattern.
After a long black candle in the downward trend is Opening of the next trading at a new low.
During this trading day, but accept that the bulls Scepter and the closing price is above the middle of the previous day candle body.
The Piercing Line bullish can depending on the prevailing trend or be bearish.
to the topDark Cloud Cover
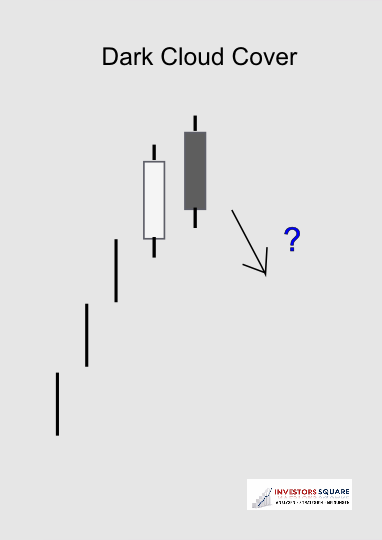
Dark Cloud Cover
The "Dark Cloud Cover" is a long black candle in a Uptrend, the closing price (Body bottom) at least in the lower third the previous candle (white) should be.
The pattern indicates a trend reversal, after an intraday high Have used sales.
to the topBullish Doji Star
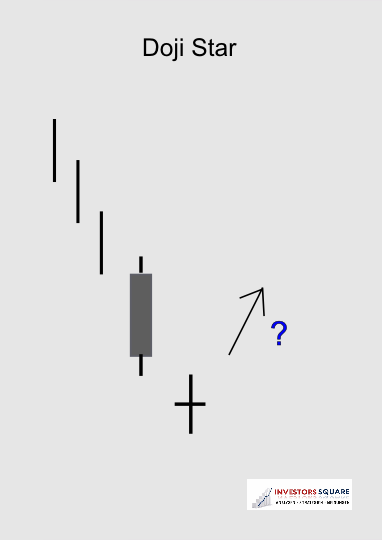
The bullishe Doji Star
A "Doji Star" always contains the information that on this day The Bulls & Bears went with a draw back home!
Thus, the "doji star" occurs primarily on turnaround in areas. this Candle pattern does not exactly have the same opening and closing, but it no body should also be recognized.
to the topBearish Doji Star
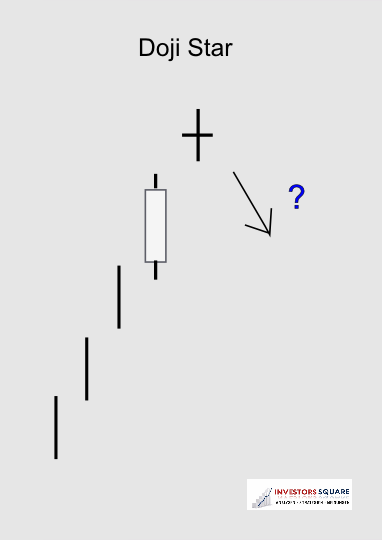
The bearishe Doji Star
A "Doji Star" always contains the information that the cops that day & Bears are left with a draw back home!
Thus, the "doji star" occurs primarily on turnaround in areas. This candle pattern must not have exactly the same opening and closing, but it should no body to be seen.
to the topMorning Star
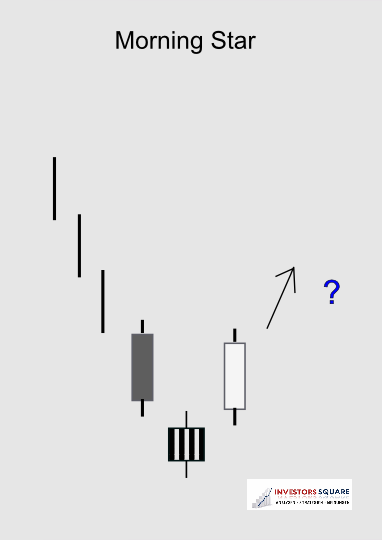
The Morning Star
The "Morning Star" is one of the three candles patterns, because after a long black candle a often a square body with short shadows created (the real "star").
Then the turnaround success with a long bullish Candle. The "Morning Star" itself is usually caused by gaps (price gaps) of the neighboring candles separately.
to the topEvening Star
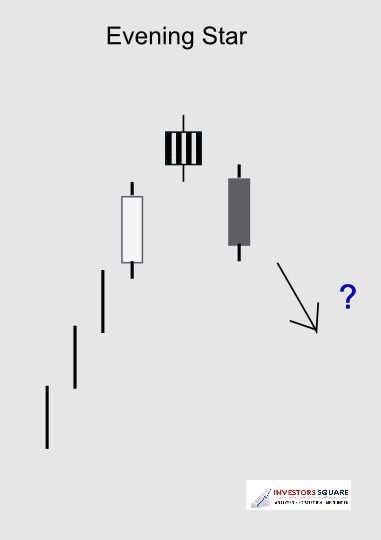
The Evening Star
The "Evening Star" is the Pendant the "Morning Star". In an uptrend intact and is a long white candlestick formed. The next trading day opened with a gap up.
The cops, however, have no more clout and it forms with a small (usually square) plug body little shade from. The trend reversal is completed and confirmed by a long black candlestick with a gap down.
to the topMorning Doji Star
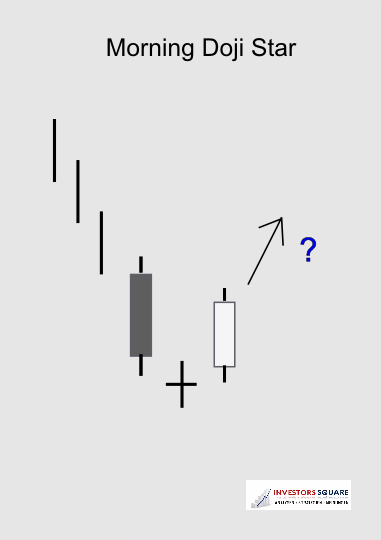
The Morning Doji Star
The "Morning Doji Star" is one of the three candles patterns! The sequence is identical to the "Morning Star," but forms on the day of the "Stars" no body of but a Doji / Cross.
to the topEvening Doji Star

The Evening Doji Star
The "Evening Doji Star" is one of the three candles patterns! The sequence is identical to the "Evening Star" but forms on the day of the "Stars" no body of but a Doji / Cross.
to the topBullish Abandoned Baby
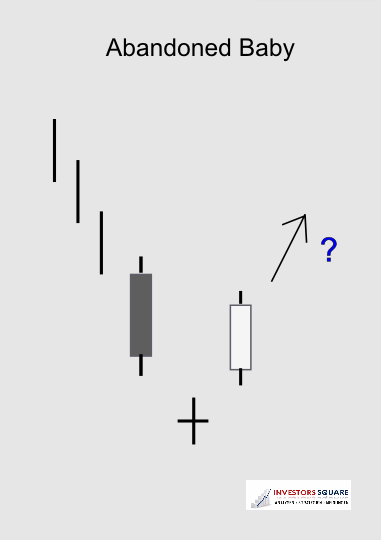
The Bullish Abandoned Baby
The "Abondened Baby" is one of the three candles patterns, because there is already a candle trend reversal has taken place.
The "abandoned baby" is much like the Morning / Evening Star, But in this Doji Candlestick Pattern is complete (and the intraday price high) by gaps (price gaps) separated from its neighboring candles.
to the topBearish Abandoned Baby
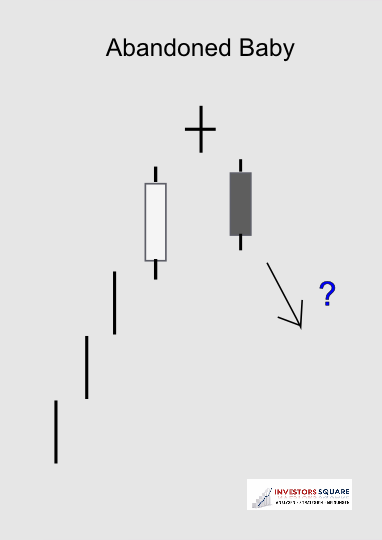
The Bearish Abandoned Baby
The "Abondened Baby" is one of the three candles patterns, because there is already a candle trend reversal has taken place.
The "abandoned baby" is much like the Morning / Evening Star, But in this Doji Candlestick Pattern is complete (and the intraday price high) by gaps (price gaps) separated from its neighboring candles.
to the top